October Updates – Bookmarking in Power BI

Enhancing Power BI Reports with Bookmarking: Navigating Your Data Story

Well, it is almost that time of the month again! New feature releases from Power BI! I can honestly say this is only one of two reasons I am looking forward to November in Chicago. (Hint: I am not a fan of the cold). I wanted to make sure everyone has looked at the October updates before we get tempted with the November release. There were some awesome features release in October!

The team at Microsoft heard my pleas and made my wishes come true – they released Bookmarking. You are now able to use the bookmarking feature to navigate through a report. The added ability to create different bookmarks that have different visuals showing, makes the possibilities endless. It’s a great way to help your users navigate through a dense set of report pages.

Last month I published a short blog using the Drillthrough feature as a substitute for navigation, in this blog I will update the O365 content pack to use the new Bookmarking feature. So, let’s get started.

First things first, make sure you have downloaded the Office365 adoption preview. If you are not familiar with it or don’t have it, get it here:

  • Download the Power BI desktop template for O365 Adoption Pack
  • If you need assistance you can reference here
  • Another pre-prerequisite is to download and install the October version of Power BI (click to download). Make sure to go into options and turn on the preview feature for Bookmarking. You will know if you have done this by clicking on the “View” tab in the report. You will see two new view options for the Bookmarks pane and Selection pane. Now we can play!

On the first page you will see a summary and explanation of how to use the report. To help our users get right to what they care about, we are going to make the product images clickable. This way a user clicks on the image and then they go right to the usage page for that product.

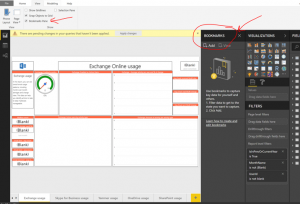
When implementing the bookmarks, you have start where you want to end up. Let’s start with the first product image, Exchange. Navigate to the Exchange usage page in the report. From the View tab, mark the checkbox for Bookmarks Pane. This will add a new pane to the right of the Visualizations pane.

Since we want this to be the page the user lands on when they click the Exchange icon, we will create a bookmark of this page. From the new Bookmarks pane click the Add button. Power BI creates a new bookmark of this page and titles it “Bookmark 1”. Let’s rename this to Exchange by clicking the “…” and selecting “Rename”. You can also double click on the title of the Bookmark to rename it. Now repeat this for each of the products. Here is a summary of the steps.

  1. Navigate to the page you want to end up on
  2. Be sure you have the Bookmarks Pane viewable
  3. From the Bookmarks Pane, click Add
  4. Double click in title of new Bookmark to rename it.
  5. Ok now that we have all our bookmarks created, let go create the links.

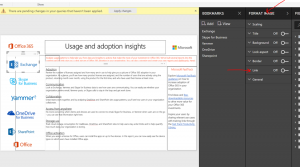
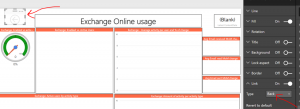
Navigate back to the “About the Adoption Content Pack” page in the report. Select the border around the images and move it over so we can easily select the individual images. Select the Exchange image. The Visualization pane will now show you the formatting options for the image. There is a new section called “Link”. Click the toggle to turn this on.

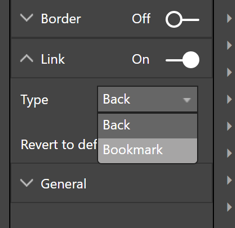
Once you have toggled this on, expand the section to see the different options. In this case we only see the Type option. Hit the down arrow and select “Bookmark”.

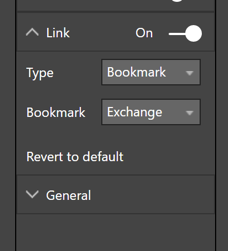
Once you have selected Bookmark a second option appears in the Link section called Bookmark. Click the drop down and select the appropriate product bookmark. Since we are working on the Exchange icon, I select Exchange.

Now repeat these steps for each of the product images.

  1. Select the image
  2. Turn on Links in the Format Image pane
  3. Change the Type to Bookmark
  4. Select the appropriate bookmark for the image.

Once we have assigned a link to all our product images we just need to clean up our border we moved earlier. Go ahead and select the border shape and drag it back into place. We will also need to send this to the back now so that the images are on top and clickable. To do this click on the Format tab at the top of the page. Be sure you still have the border shape selected. Click the down arrow for “Send backward” and select “Send to back”. This will put the border image behind all the product images. If you are as much of a perfectionist as I am, I would also resize and fix alignment of the product images.

Congratulations, you have added navigation! It is just that easy. There is one more thing I would do however, and that is add a “back” button on each of the pages. The process is the same but instead of selecting “Bookmark” in the Link type, select a type of “Back”. This will take the user back to the page them came from, so in this case the “About the Adoption Content Pack” page.

To test the navigation, hold down the control key on your keyboard and click on the product images and back button. You only need to do this if you are in Power BI desktop or edit mode from the web service. Users interacting with the report in Reading view from the web service will just click on the image.

This was just a simple example of how bookmarking can enhance the capability to tell a story with your reports. Once you add in hiding and showing individual visuals, the ability to get creative expands 10-fold. I will cover the showing of individual visuals this in another blog.

Thanks for reading and have fun with it!

Written By Amy Schneider